
Hello,
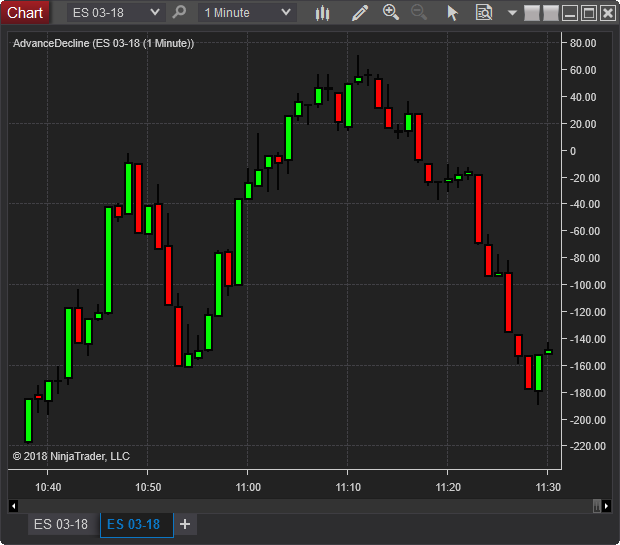
I have a 1-minute chart and I've also added a 60-minute data series. Currently, NinjaTrader is plotting the 1-minute candles.
Now, I would like to visually represent the 60-minute bars as rectangles in the background to better see the higher timeframe context. Can I achieve this by drawing rectangles directly on the chart?
What would you recommend as the best-practice approach to accomplish this clearly and efficiently?
Thank you very much in advance for your advice!
Kind regards, Gerik


Comment