Announcement

Collapse

Looking for a User App or Add-On built by the NinjaTrader community?

Visit NinjaTrader EcoSystem and our free User App Share!

Have a question for the NinjaScript developer community? Open a new thread in our NinjaScript File Sharing Discussion Forum!
See more
See less

Partner 728x90

Collapse

What needs to be done to implement plot signal from custom indicator

Collapse
X
 
  • Filter
  • Time
  • Show
Clear All
new posts

    What needs to be done to implement plot signal from custom indicator

    Hi i would like to add a condition to my strategy to enter when signal is in red, blue, yellow or green for example. I am not sure what needs to be done to call that indicator in the strategy..

    This is a very simple indicator. It reflects possible price trend and colors the chart based on the slope of ADX (14 Period) and EMA (14 period) of an instrument. Green: Rising ADX & Rising EMA (Could be an uptrend) Blue: Falling ADX & Rising EMA (Could be a slowing uptrend) Red: Rising ADX & […]

    #2
    Hello, thanks for writing in. All indicator have the PlotBrushes property where the plot color can be read/set per bar:

    https://ninjatrader.com/support/help...lotbrushes.htm //e.g. PlotBrushes[0][0] is the latest bar of the first added plot.

    Typically the color changes based on some underlying condition, so you could also replicate the condition that is changing the color of the plot rather than reading the color e.g.

    if(Close[0] > Close[1])
    PlotBrushes[0][0] = Brushes.Green;
    Chris L.NinjaTrader Customer Service

    Comment


      #3
      Thank you. I am still confused if i put if how will strategy know how these plots coming from this particular custom indicator?
      Do you have an example where strategy uses indicators values?
      (Close[0] > Close[1])
      PlotBrushes[0][0] = Brushes.Green;​

      Ok Update.
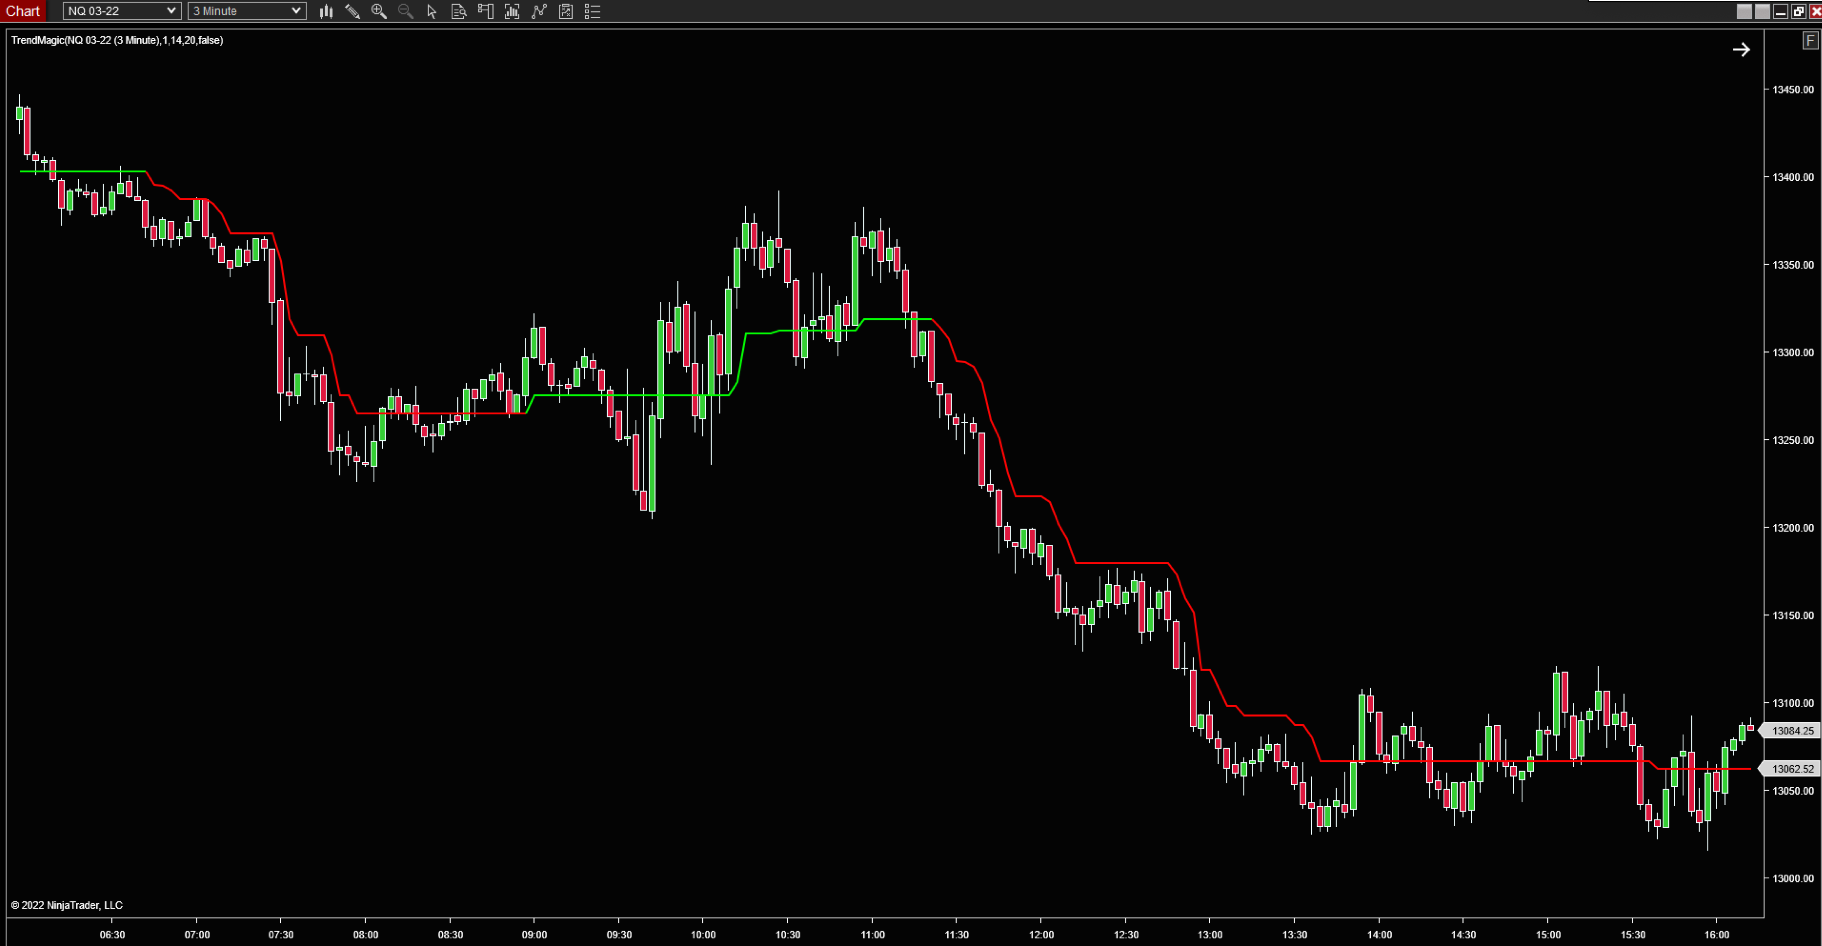
      I am trying to get signals from trend magic indicator. I added this but its compalining no overload method trenmagic takes 0 arguments. I just want buy when gree, sell when red logic in strategy
      The Trend Magic indicator is an ATR-based trend line that uses CCI to control its upward and downward movement. It was once a popular indicator in the Forex trading world. When the CCI is greater than zero the line is only able to move upwards, and conversely, when the CCI is less than or equal […]


      else if (State == State.DataLoaded)
      {
      {
      ClearOutputWindow(); //Clears Output window every time strategy is enabled
      }
      AddChartIndicator(TrendMagic());​
      Last edited by tkaboris; 03-02-2023, 10:05 AM.

      Comment


        #4
        Hi, the SampleMaCrossover strategy built into the platform exemplifies how you set up Indicator objects in a script. This would be the best reference on how to initialize other indicators within your script.

        Kind regards,

        -ChrisL
        Chris L.NinjaTrader Customer Service

        Comment


          #5
          NinjaTrader_ChrisL
          i have
          private TrendMagic myTM;
          myTM = TrendMagic();

          In my strategy on BarUpdate i am trying to access BullBrush to see if it can access it but it get "canno immplicitly convert type System.windows.media.brush to bool

          if(myTM.BullBrush)
          {
          Print("bull brush is true");
          }​
          Last edited by tkaboris; 03-02-2023, 11:38 AM.

          Comment


            #6
            Hi, the SampleMACrossover strategy show you how you set up indicators within another script. E.g. if you do Right click>Save As on this script to make a copy of it you can add extra Prints to it to see the data being produced by the SMA indicator.

            Attached Files
            Chris L.NinjaTrader Customer Service

            Comment


              #7
              I found someone already implemented plotting for trendmagic indicator for strategy. However he didnt implement plotting for when CCI is used. can someone help me to plot those as well?
              Code:
              protected override void OnStateChange()
                      {
                          if (State == State.SetDefaults)
                          {
                              Description                        = @"An ATR based trendline regulated by the position of CCI and its zero line.";
                              Name                            = "TrendMagic";
                              IsOverlay                        = true;
                              IsSuspendedWhileInactive        = true;
                              cciPeriod                         = 20;
                              atrPeriod                         = 14;
                              atrMult                            = 1.0;
                              useCciTrendColor                = false;
                              BullBrush                        = Brushes.Lime;
                              BearBrush                        = Brushes.Red;
                              AddPlot(new Stroke(Brushes.Orange, 2), PlotStyle.Line, Name);
              [B] AddPlot(Brushes.Transparent, "Trend Output");
                              AddPlot(Brushes.Transparent, "Buy/Sell Output");[/B]
                          }
                          else if (State == State.DataLoaded)
                          {
                              Trend[0] = 0;
                              lineColor = new Series<double>(this);
                          }
                      }
              
              
                      protected override void OnBarUpdate()
                      {
                          if (CurrentBar < cciPeriod || CurrentBar < atrPeriod)
                              return;
              
                          cciVal = CCI(Close, cciPeriod)[0];
                          atrVal = ATR(Close, atrPeriod)[0];
              
                          upTrend = Low[0] - atrVal * atrMult;
                          downTrend = High[0] + atrVal * atrMult;
              
                          if (cciVal >= 0)
                              if (upTrend < Trend[1])
                                  Trend[0] = Trend[1];
                              else
                                  Trend[0] = upTrend;
                          else
                              if (downTrend > Trend[1])
                                  Trend[0] = Trend[1];
                              else
                                  Trend[0] = downTrend;
              
              [B] TrendOutput[0] = Trend[0] > Trend[1] ? 1 : Trend[0] < Trend[1] ? -1 : TrendOutput[1];
                          BuySellOutput[0] = TrendOutput[0] == 1 && TrendOutput[1] != 1 ? 1 : TrendOutput[0] == -1 && TrendOutput[1] != -1 ? -1 : 0;[/B]
              
                          if (useCciTrendColor)
                              lineColor[0] = cciVal > 0 ? 1 : -1;
                          else
                              lineColor[0] = TrendOutput[0];
              
                          PlotBrushes[0][0] = lineColor[0] == 1 ? BullBrush : BearBrush;    
                      }​

              Comment

              Latest Posts

              Collapse

              Topics Statistics Last Post
              Started by burtoninlondon, Today, 12:38 AM
              0 responses
              5 views
              0 likes
              Last Post burtoninlondon  
              Started by AaronKoRn, Yesterday, 09:49 PM
              0 responses
              13 views
              0 likes
              Last Post AaronKoRn  
              Started by carnitron, Yesterday, 08:42 PM
              0 responses
              11 views
              0 likes
              Last Post carnitron  
              Started by strategist007, Yesterday, 07:51 PM
              0 responses
              13 views
              0 likes
              Last Post strategist007  
              Started by StockTrader88, 03-06-2021, 08:58 AM
              44 responses
              3,982 views
              3 likes
              Last Post jhudas88  
              Working...
              X