
Hello, everyone!
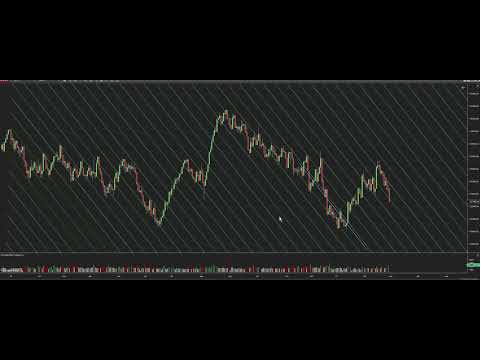
I’m facing an issue with the platform and I’d like to know if anyone has experienced this or has any idea how to fix it. When observing the chart, I notice two types of drawings: the first one, in green, represents a channel that I drew and replicated several times; the second is a blue line, which I used as a marker to highlight a possible issue.
The problem happens when I scroll the chart forward or backward: these two elements become misaligned, showing strange behavior on the platform. This misalignment is quite concerning, as it can lead to false buy or sell signals. Moreover, I notice that it’s not just the lines that become misaligned — it also affects the relationship with the candles. When focusing on a specific line, it becomes clear that as I move the chart, the channels shift their position relative to the candles.
It’s funny how the drawings seem to dance on the chart, as if the drawing plane moves independently from the candle plane. This is a very serious issue that needs attention.
It’s worth mentioning that the channels are locked to prevent accidental movement, which reinforces the abnormality of this behavior. I’ve tried everything to fix it, but so far, I haven’t had any success.
Does anyone have any idea what might be happening or has faced something similar? Any help would be greatly appreciated!
Thank you!
Comment