
Hello,
I'm using the volumetric bars chart and I'd like to see the candle wick and candle in the center of the box.
If I use the "center open close bar" option, I see the candle in the center of the box but I can't see the candle wick.
If I add a second dataseries to achive it, the candle is not in the center but is on the right of the box.
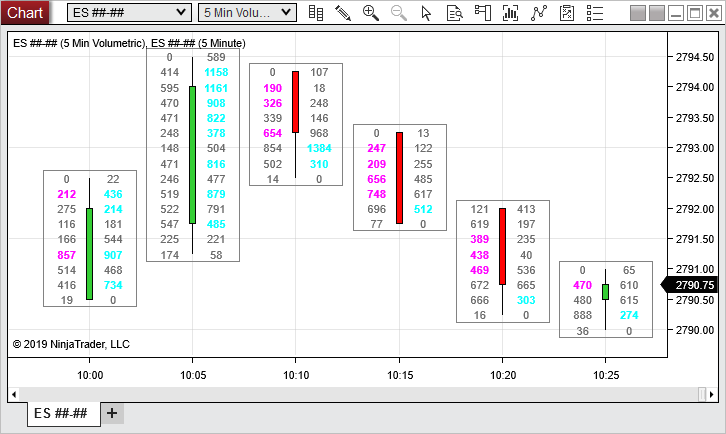
This is the chart I want to use:
I understand the "center open close bar" option was added later, but is very strange I can't achive the "old" look after this feature added.
Thanks.
Regards,
I'm using the volumetric bars chart and I'd like to see the candle wick and candle in the center of the box.
If I use the "center open close bar" option, I see the candle in the center of the box but I can't see the candle wick.
If I add a second dataseries to achive it, the candle is not in the center but is on the right of the box.
This is the chart I want to use:
I understand the "center open close bar" option was added later, but is very strange I can't achive the "old" look after this feature added.
Thanks.
Regards,
Comment