How can I get something similar on NT8? if there is nothing exactly similar, then what can I put on a chart to at least indicate in a similar way the "volatility range" of the visible chart?
Announcement
Collapse
No announcement yet.
Partner 728x90
Collapse
NinjaTrader
Pip range displayed on chart?
Collapse
X
-
Pip range displayed on chart?
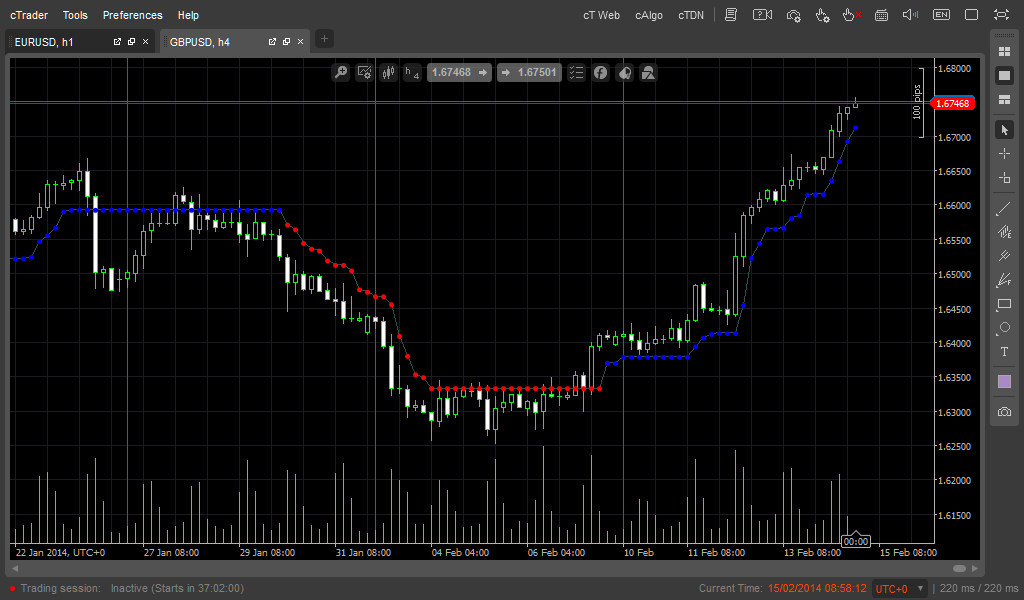
If you look at the top right corner of a cTrader chart you will see a pip range displayed.
How can I get something similar on NT8? if there is nothing exactly similar, then what can I put on a chart to at least indicate in a similar way the "volatility range" of the visible chart?
-
Hello NinjaCustomer,
Thanks for writing in.
At this time there is not a way to display the pip range in the same way it is displayed in cTrader in NinjaTrader.
There are various indicators you can look into using to try to track the price oscillation, you can take a look at the Rate of Change indicator here and all of our other indicator definitions in our help guide:
Rate of change:
https://ninjatrader.com/support/help...change_roc.htm
System indicator methods:
https://ninjatrader.com/support/help...indicators.htm
Please let me know if I may be of any further assistance.Alan S.NinjaTrader Customer Service
Latest Posts
Collapse
Topics | Statistics | Last Post | ||
---|---|---|---|---|
Started by ZenCortexAuCost, Today, 04:24 AM
|
0 responses
5 views
0 likes
|
Last Post Today, 04:24 AM | ||
Started by ZenCortexAuCost, Today, 04:22 AM
|
0 responses
2 views
0 likes
|
Last Post Today, 04:22 AM | ||
Started by SantoshXX, Today, 03:09 AM
|
0 responses
15 views
0 likes
|
Last Post
by SantoshXX
Today, 03:09 AM
|
||
Started by DanielTynera, Today, 01:14 AM
|
0 responses
3 views
0 likes
|
Last Post
by DanielTynera
Today, 01:14 AM
|
||
Started by yertle, 04-18-2024, 08:38 AM
|
9 responses
42 views
0 likes
|
Last Post
by yertle
Today, 01:00 AM
|
Comment