
Take a look at the screenshot below.
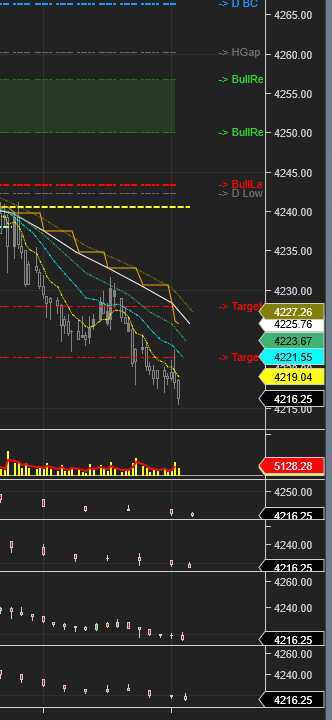
I have a 2 minute chart with an added 15 minute data series.
Then, I added an EMA indicator to the chart, on the 15 minute data series and told it to calculate on every tick. This is the WHITE plot line.
As you can see, it is a smooth plot.
I am trying to access these "smooth" values from my 2 minute series and the plot looks like a staircase.
Now, I get it... you're going to tell me that it looks like that because on the 2m series it is still "waiting" for the 15m bar to close, so the values are "constant" then gap up or down when the higher dataframe bars close. However, my indicator is set to calculate on every tick and I'd like that for ALL dataseries added, so I can access the values are they come.
Well, if I can see the perfectly smooth white line, how do I access those EXACT values on my 2 minute timeframe?
This is a sample code I have:
...
else if (State == State.Configure)
{
AddDataSeries(Data.BarsPeriodType.Minute, 5);
AddDataSeries(Data.BarsPeriodType.Minute, 10);
AddDataSeries(Data.BarsPeriodType.Minute, 15);
AddDataSeries(Data.BarsPeriodType.Minute, 20);
}
....
protected override void OnBarUpdate()
{
if (CurrentBar < 200) {
return ;
}
if (BarsInProgress == 0) {
Values[1][0] = EMA(Closes[3], 8)[0];
}
}
Thank you KINDLY.
Comment