
Hello,
First of all, I am really new with NT7... There must be simple thing I am missing so I created an account to ask you guys.
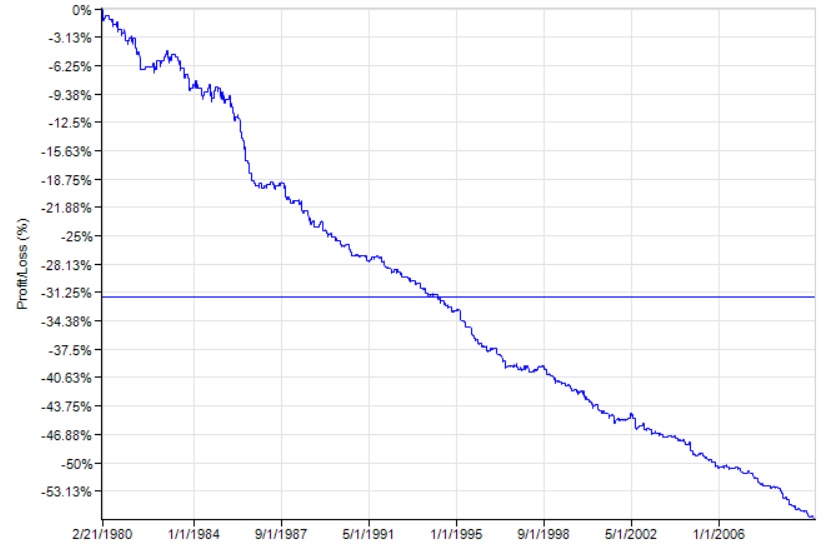
I am in my last year of bachelors and decided to write my thesis on EMH and technical analysis (challenging but really interesting topic to me). I chose Bollinger bands as my indicator and ran a super simple back-test. Results were interesting. This is my cumulative profit graph (for eur/usd 1980-2010 period):
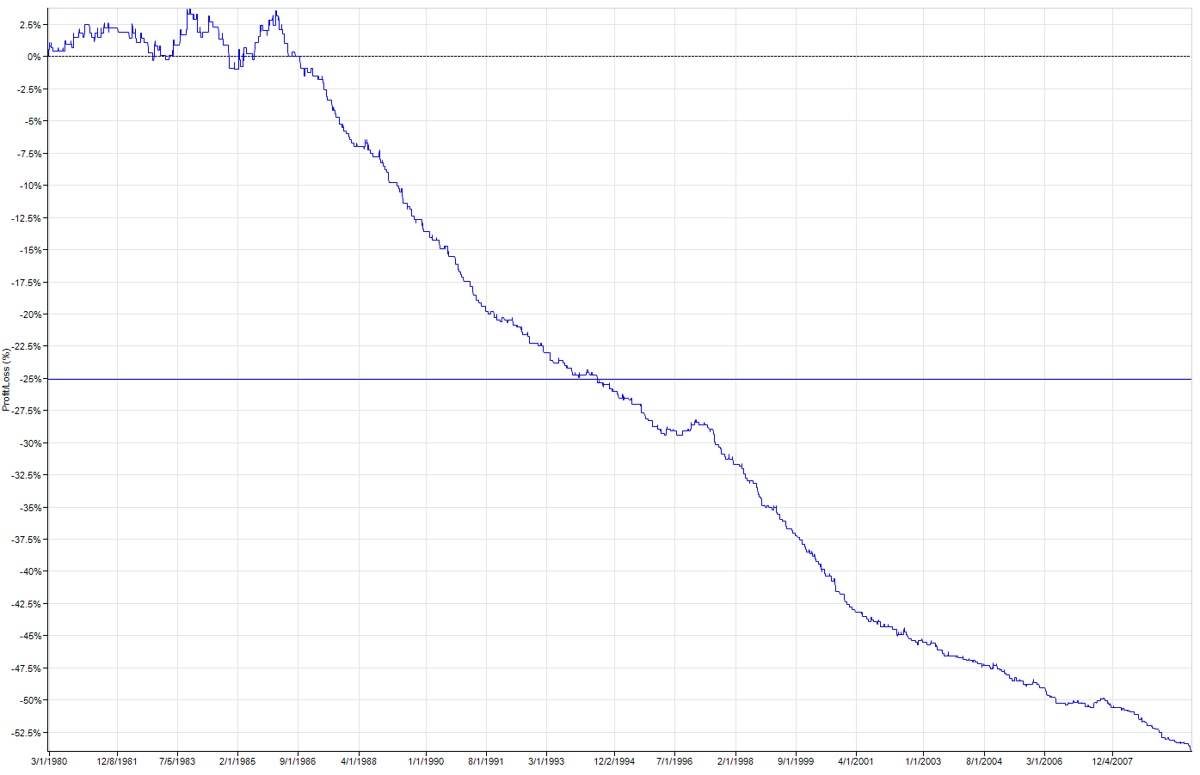
I thought by reversing (longing when I was shorting and shorting when I was longing) my strategy I should get exactly opposite results as I am using stop loss/take profit functions as well. However I got this:
So basically I backtest opposite strategies and I get same result... I found this confusing and tried checking my chart for when I enter/exit positions. I observed a really interesting thing for one of the months.
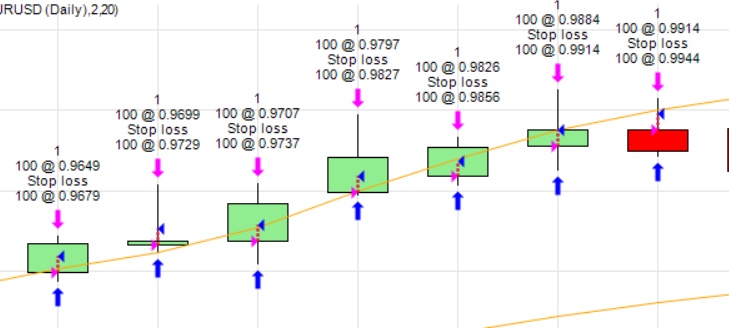
Normal Bollinger:
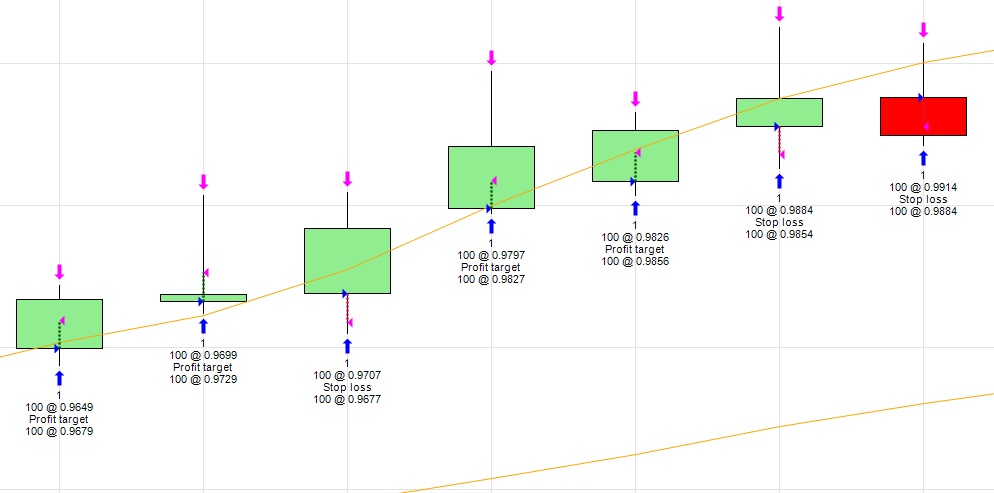
Reverse Bollinger:
Basically I enter positions at same prices with stop loss/take profit of 30 pips and these positions do not offset each other... Therefore in both strategies i get around 30% winning trades and 70% losing trades doing exactly opposite things...
I hope my problem here is clear and I would appreciate some help... If someone would be willing to guide me through my work and help me out with further questions I would really appreciate if you PMed me and we would exchange skypes..
Thank you all in advance
First of all, I am really new with NT7... There must be simple thing I am missing so I created an account to ask you guys.
I am in my last year of bachelors and decided to write my thesis on EMH and technical analysis (challenging but really interesting topic to me). I chose Bollinger bands as my indicator and ran a super simple back-test. Results were interesting. This is my cumulative profit graph (for eur/usd 1980-2010 period):
I thought by reversing (longing when I was shorting and shorting when I was longing) my strategy I should get exactly opposite results as I am using stop loss/take profit functions as well. However I got this:
So basically I backtest opposite strategies and I get same result... I found this confusing and tried checking my chart for when I enter/exit positions. I observed a really interesting thing for one of the months.
Normal Bollinger:
Reverse Bollinger:
Basically I enter positions at same prices with stop loss/take profit of 30 pips and these positions do not offset each other... Therefore in both strategies i get around 30% winning trades and 70% losing trades doing exactly opposite things...
I hope my problem here is clear and I would appreciate some help... If someone would be willing to guide me through my work and help me out with further questions I would really appreciate if you PMed me and we would exchange skypes..
Thank you all in advance
")
Comment