Announcement

Collapse
No announcement yet.

Partner 728x90

Collapse

New to NT. Problem with 2000T

Collapse
X
 
  • Filter
  • Time
  • Show
Clear All
new posts

    New to NT. Problem with 2000T

    Hello everyone. I am just getting familiar with NT and it looks like a solid product. I am having an issue though with a chart type. I am trying to follow someone elses instruction and he uses the 2000 tick chart with NT. The problem is that after selecting a new chart and using the ES 9/12 and then entering 2000T in the open area, it does change to that cart but shows no information. What I mean is that up top, it indicates that it is displaying the 2000 tick and that is also verified by checking the data series. The problems is that all I see is one vertical candlestick and changes periodically (I assume with the price) but no history to the left of it. The slide on the bottom fills the entire bottom and so nothing is being displayed there for me to grab and move. Last night I don't remember exactly what I did but I saw a few of the trades I made (as they do display on the chart) just under this vertical candlestick. It's as if all of the information is being squished into one vertical line instead of displaying the history. Has anyone heard of this? If I choose the 2 minute, 5 minute, or any other menu item, it works fine.

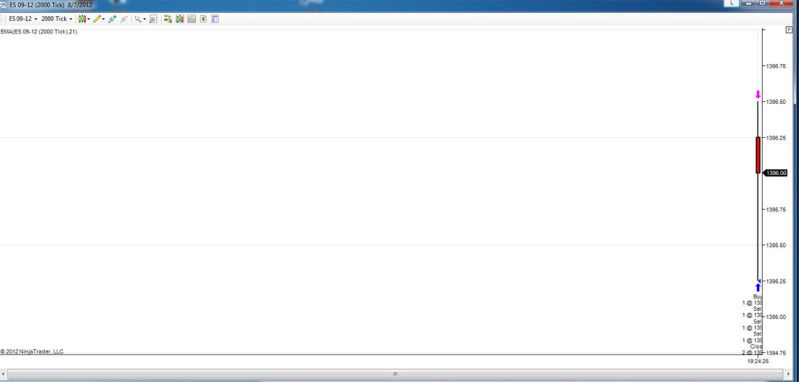
    Edit: Also wanted to add that after selecting the 2000T, it shows only and increment of .25 point and I can grab it vertically and change it to show as many increments as I need but I still don't see any history. As I said though, I can see a bunch of my trades all together under the one vertical bar. If I can figure out how to take a screenshot of it, I will post it here.
    Last edited by hawkeye; 08-07-2012, 08:00 PM.

    #2
    Hello,

    Thank you for your post and welcome to our forums!

    Can you please clarify who you connect to for data? This is displayed in the bottom left hand corner of the NinjaTrader Control Center.
    MatthewNinjaTrader Product Management

    Comment


      #3
      Originally posted by NinjaTrader_Matthew View Post
      Hello,

      Thank you for your post and welcome to our forums!

      Can you please clarify who you connect to for data? This is displayed in the bottom left hand corner of the NinjaTrader Control Center.

      Yes, I use IB. Currently a paper trade account. As I mentioned, all other charts look good though. One other thing I did was I kept moving the vertical increments and the more increments that were displaying, the more of my trades I could see posted under.

      Comment


        #4
        IB does not offer historical tick data.

        Chart bars will however be built as time passes so if you left NinjaTrader running with an open chart for 60 minutes you would have a 1 minute chart with an hour of historical data on it.

        Click here for more information on the varying levels of data of our supported connectivity providers
        MatthewNinjaTrader Product Management

        Comment


          #5
          Here is a screenshot:

          Comment


            #6
            Originally posted by NinjaTrader_Matthew View Post
            IB does not offer historical tick data.

            Chart bars will however be built as time passes so if you left NinjaTrader running with an open chart for 60 minutes you would have a 1 minute chart with an hour of historical data on it.

            Click here for more information on the varying levels of data of our supported connectivity providers
            Okay, well this makes sense then. It did appear as thought he information was missing. Would have been nice it there was a message or something indicating that on the chart but hey, it's free for now, what do I want right? Okay, so the big decision is whether as a paper trader it is worth paying at least $50 a month for data when I'm not earning anything yet. I was kind of okay paying IB there $10 but will have to think about this one.

            Also, can you explain why the other charts work though? I didn't make the connection because the 5 minute and all of the other charts worked fine. Why is that the 2000T will not work with the same historical data?
            Last edited by hawkeye; 08-07-2012, 08:35 PM.

            Comment


              #7
              Originally posted by hawkeye View Post
              Okay, well this makes sense then. It did appear as thought he information was missing. Would have been nice it there was a message or something indicating that on the chart but hey, it's free for now, what do I want right? Okay, so the big decision is whether as a paper trader it is worth paying at least $50 a month for data when I'm not earning anything yet. I was kind of okay paying IB there $10 but will have to think about this one.

              Also, can you explain why the other charts work though? I didn't make the connection because the 5 minute and all of the other charts worked fine. Why is that the 2000T will not work with the same historical data?
              5 minute chart is not built from tick data, but from minute data. Ticks are smaller than minutes.

              You need to record data if you want tick charts or download recorded data if supported. Then you can use market replay.


              There will be a few other charts that will fail because they are built off of ticks.

              Comment


                #8
                Originally posted by hawkeye View Post
                Okay, well this makes sense then. It did appear as thought he information was missing. Would have been nice it there was a message or something indicating that on the chart but hey, it's free for now, what do I want right? Okay, so the big decision is whether as a paper trader it is worth paying at least $50 a month for data when I'm not earning anything yet. I was kind of okay paying IB there $10 but will have to think about this one.

                Also, can you explain why the other charts work though? I didn't make the connection because the 5 minute and all of the other charts worked fine. Why is that the 2000T will not work with the same historical data?
                Please see our Help Guide article on Understanding the underlying base data type required for constructing various chart bars:

                MatthewNinjaTrader Product Management

                Comment


                  #9
                  Originally posted by sledge View Post
                  5 minute chart is not built from tick data, but from minute data. Ticks are smaller than minutes.

                  You need to record data if you want tick charts or download recorded data if supported. Then you can use market replay.


                  There will be a few other charts that will fail because they are built off of ticks.

                  I guess I will ask this here since it is kind of relevant. Let's say I just wanted to watch a chart of the ES for practice in helping me identify trends, etc. Aside from recording it myself each day, where can I get historical ticks and can I play them back here in NT? Something that will allow me to trade, draw lines, etc? I'm new to this so I don't think this is backtesting. It's just watching a trade session.

                  Comment


                    #10
                    You can download market replay data from our servers for futures and forex. This means you do not need to record it yourself.

                    Please see the following videos on this topic:

                    Downloading Replay Data

                    Working with Market Replay
                    MatthewNinjaTrader Product Management

                    Comment


                      #11
                      Thank you for the information on replay data. I have that now setup. I was very excited but once I started it and tried to use the 2000T chart, it did not display. So I guess I will ask then, can I not see a 2000T chart in replay mode? And I guess to confirm my suspicion, the only way for me to see replay information (or live for that matter) would be to subscribe to a data service that provides it?

                      Man, I was so excited. Shoot. Oh well, let me know and I'll go from there. It's just that I am trying to practice trading from a 2000T chart. Is that not possible anywhere?

                      Comment


                        #12
                        If you were using a live license key, the 2000T chart would be back filled on market replay from our servers.

                        With the simulation license key, you will need to subscribe to a provider who offers historical tick data.
                        MatthewNinjaTrader Product Management

                        Comment


                          #13
                          Well, it appears I'm having a different problem. When I select the chart size as daily, I can see the candlesticks but from 60 minutes forward, I cannot see any data on the chart. I wondered if it had something to do with the increments on the right but I'm guessing the increments viewed would not be just .25 range if there as actually data to display. Is there a reason why I cannot see anything on a, for example, 5 minute chart?

                          Edit: I also tried downloading multiple days and selecting a date in the middle of the range but with the exception of the monthly and daily charts, nothing else shows up.
                          Last edited by hawkeye; 08-08-2012, 08:54 PM.

                          Comment


                            #14
                            What date and contract did you download? (E.g. 8/6/2012 ES 09-12)?
                            MatthewNinjaTrader Product Management

                            Comment


                              #15
                              Originally posted by NinjaTrader_Matthew View Post
                              What date and contract did you download? (E.g. 8/6/2012 ES 09-12)?
                              I downloaded the default ES 09-12 dates 7/1, 7/2 and 7/3. I downloaded both level 1 and level 2.

                              Very strange because as I said, I can see the daily. Shows the whole thing so I know that it is importing it but nothing less than that though. And because the increments on the right start at zero on the bottom and .25 at the top, that is telling me that there is no data on the page. I tried to grab and increase those increments but I can only do it once to then show .50 but if I go back and grab it again, it resets back to .0-.25

                              Comment

                              Latest Posts

                              Collapse

                              Topics Statistics Last Post
                              Started by argusthome, 03-08-2026, 10:06 AM
                              0 responses
                              95 views
                              0 likes
                              Last Post argusthome  
                              Started by NabilKhattabi, 03-06-2026, 11:18 AM
                              0 responses
                              49 views
                              0 likes
                              Last Post NabilKhattabi  
                              Started by Deep42, 03-06-2026, 12:28 AM
                              0 responses
                              31 views
                              0 likes
                              Last Post Deep42
                              by Deep42
                               
                              Started by TheRealMorford, 03-05-2026, 06:15 PM
                              0 responses
                              35 views
                              0 likes
                              Last Post TheRealMorford  
                              Started by Mindset, 02-28-2026, 06:16 AM
                              0 responses
                              72 views
                              0 likes
                              Last Post Mindset
                              by Mindset
                               
                              Working...
                              X