
Hello,
My charts suddenly changed completely at 12.00 am and inserted what looks like 2 datelines, one at 12.00 am December 25th, and another at around 11.00 p.m. December 24th, just one hour earlier. You can see a temporary screenshot image of after 12.00 am here:
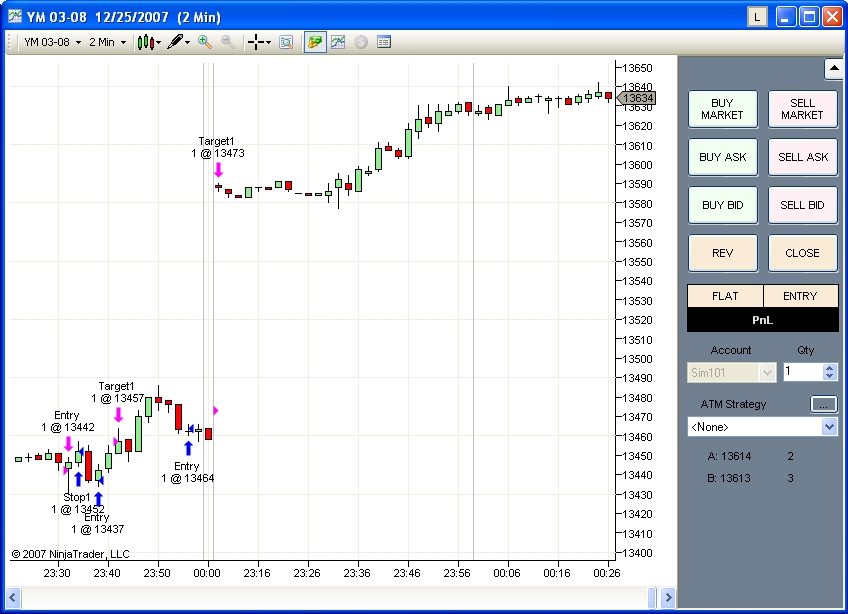
If you look at the gray datelines and the times at the bottom of the charts they seem are very unusual, also one dateline is a double gray line but the other only has a single gray line, I'm not sure if there's a difference. I looked at my charts a few minutes before 12.00 am and a few minutes after, they looked completely different.
I live out in Asia and trade at midnight daily, so this makes trading significantly more unpredictable. Thanks for your help,
Jeremy
My charts suddenly changed completely at 12.00 am and inserted what looks like 2 datelines, one at 12.00 am December 25th, and another at around 11.00 p.m. December 24th, just one hour earlier. You can see a temporary screenshot image of after 12.00 am here:
If you look at the gray datelines and the times at the bottom of the charts they seem are very unusual, also one dateline is a double gray line but the other only has a single gray line, I'm not sure if there's a difference. I looked at my charts a few minutes before 12.00 am and a few minutes after, they looked completely different.
I live out in Asia and trade at midnight daily, so this makes trading significantly more unpredictable. Thanks for your help,
Jeremy
Comment