Announcement

Collapse
No announcement yet.

Partner 728x90

Collapse

Line in different locations in 60min and daily chart

Collapse
X
 
  • Filter
  • Time
  • Show
Clear All
new posts

    Line in different locations in 60min and daily chart

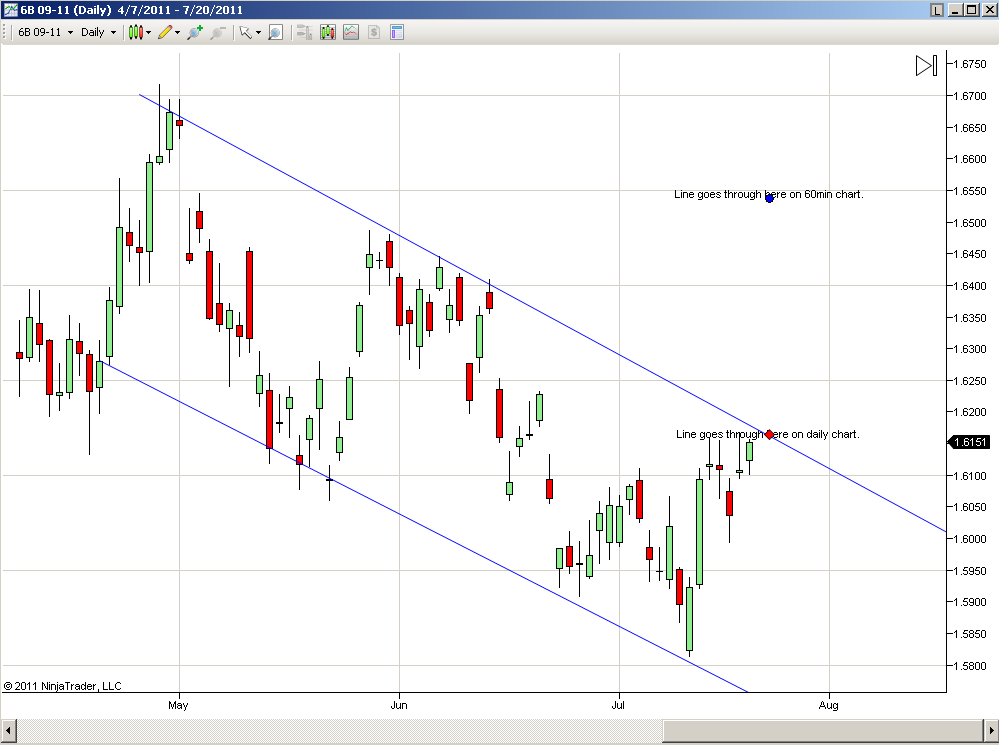
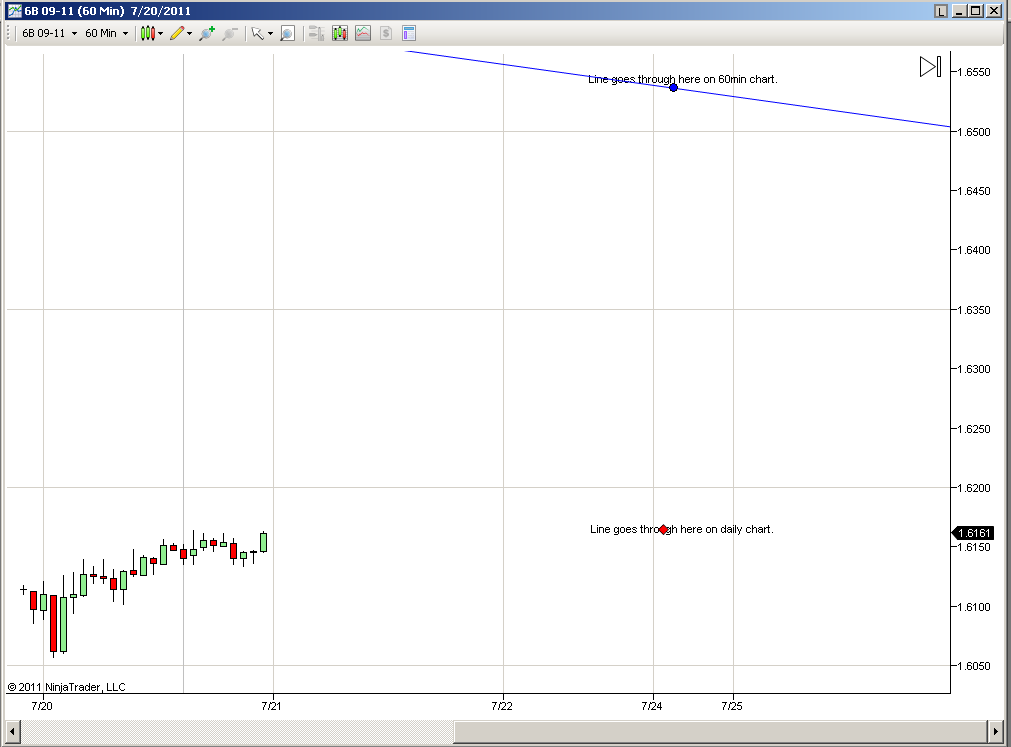
    New to NT, so not sure if it's me or if it's a bug.


    #2
    Hello :::grimReaper:::,

    Unfortunately, this is can be as expected. Can you please double click the line in both charts to open its properties menu. Select the Data-tab and check if the Y and time values are the same. If the values are different, please let me know.

    When comparing drawing tools on charts with different period types, you can experience such differences since a different time scale is used in both charts.
    JasonNinjaTrader Customer Service

    Comment


      #3
      Thanks for the fast reply,

      The y values are identical, but the time values are not. The line starts at 4/26/2011 in the daily chart, but in the hourly chart starts at 7/17/2011. I try to overwrite that with 4/26, but as soon as I hit apply, the time changes back to 7/17. Seems like 7/17 is the earliest date it can accept.

      It works when I truncate both ends, but is there any way around this?

      Comment


        #4
        Could it be the hourly chart does not contain data before 7/17?

        Please right click in the chart and select Data Series. Set 'Days to load' to the same setting as your daily chart and check if the issue remains.
        JasonNinjaTrader Customer Service

        Comment


          #5
          It works, the time and Y values are the same in both time frames for both lines.

          Though when I scroll back in the hourly chart to 7/12, the top line disappears.

          And how do I save the # of days I want to load? When I go from hourly to daily then back to hourly, it loads the default 5 days.

          Thanks for all the help.

          Comment


            #6
            Unfortunately, drawing objects can disappear on some occassions. If anchor points of the drawing object are too far away from the visible display, the object can disappear. Please scroll the visible display closer to an anchor point and the drawing object will appear again.

            You can save settings in the Data Series menu per period type. Once you set the period type to minute (hour), please right click in the grid and select 'Set Default For Minute Period Type'. More information can be found at the link below under 'Understanding Data Series default settings'.
            JasonNinjaTrader Customer Service

            Comment

            Latest Posts

            Collapse

            Topics Statistics Last Post
            Started by mattbsea, Today, 05:44 PM
            0 responses
            3 views
            0 likes
            Last Post mattbsea  
            Started by RideMe, 04-07-2024, 04:54 PM
            6 responses
            31 views
            0 likes
            Last Post RideMe
            by RideMe
             
            Started by tkaboris, Today, 05:13 PM
            0 responses
            2 views
            0 likes
            Last Post tkaboris  
            Started by GussJ, 03-04-2020, 03:11 PM
            16 responses
            3,282 views
            0 likes
            Last Post Leafcutter  
            Started by WHICKED, Today, 12:45 PM
            2 responses
            20 views
            0 likes
            Last Post WHICKED
            by WHICKED
             
            Working...
            X