
Hi, I'm sure this has been asked, but I probably don't have the terminology right for the search. I want to control the scale of my indicator labels:
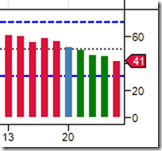
What I'd really like is the Y-Axis to show the full range 0-100 with numeric labels at 70, 50 and 30 where I have Lines defined, in addition to the 41 above which is the indicator value and working as intended.
Thanks in advance for any help.
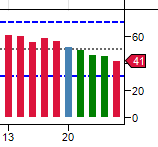
What I'd really like is the Y-Axis to show the full range 0-100 with numeric labels at 70, 50 and 30 where I have Lines defined, in addition to the 41 above which is the indicator value and working as intended.
Thanks in advance for any help.
Comment