
Forrestang,
Essentially yes. In a normal distribution, 99 percent of the data will fall within Mean +- 3*StdDev.
In your case, you mentioned you only want to filter out data that is larger in value, so we ignore the lower bound. As such you could filter/reset anything above Mean + Constant * StdDev. The constant will require some tweaking to get it exactly how you want, but you can look at this table to find what you want the constant to be :

This idea is only to avoid sorting every tick, since this can cause performance issues if its done on large data sets and many charts. You could have a SMA on a period of 500, and a StdDev on a period of 500, which would keep track of the mean and the standard deviation on the last 500 data points in your series. I assumed you wanted over the last 500 due to the histograms you displayed below.
If anything is above Mean + Constant * StandardDeviation ---> Set to Value to make insignificant (either mean, median, mode), or if you are using a list you can remove the element.
All this method would require is updating 4 extra data series rather than sorting two data series. Updating a data series with 1 new value is much more computationally efficient than sorting a whole array/list. However, if you are only sorting 20 items with COBC = true, then Koganam's recommendation is better.
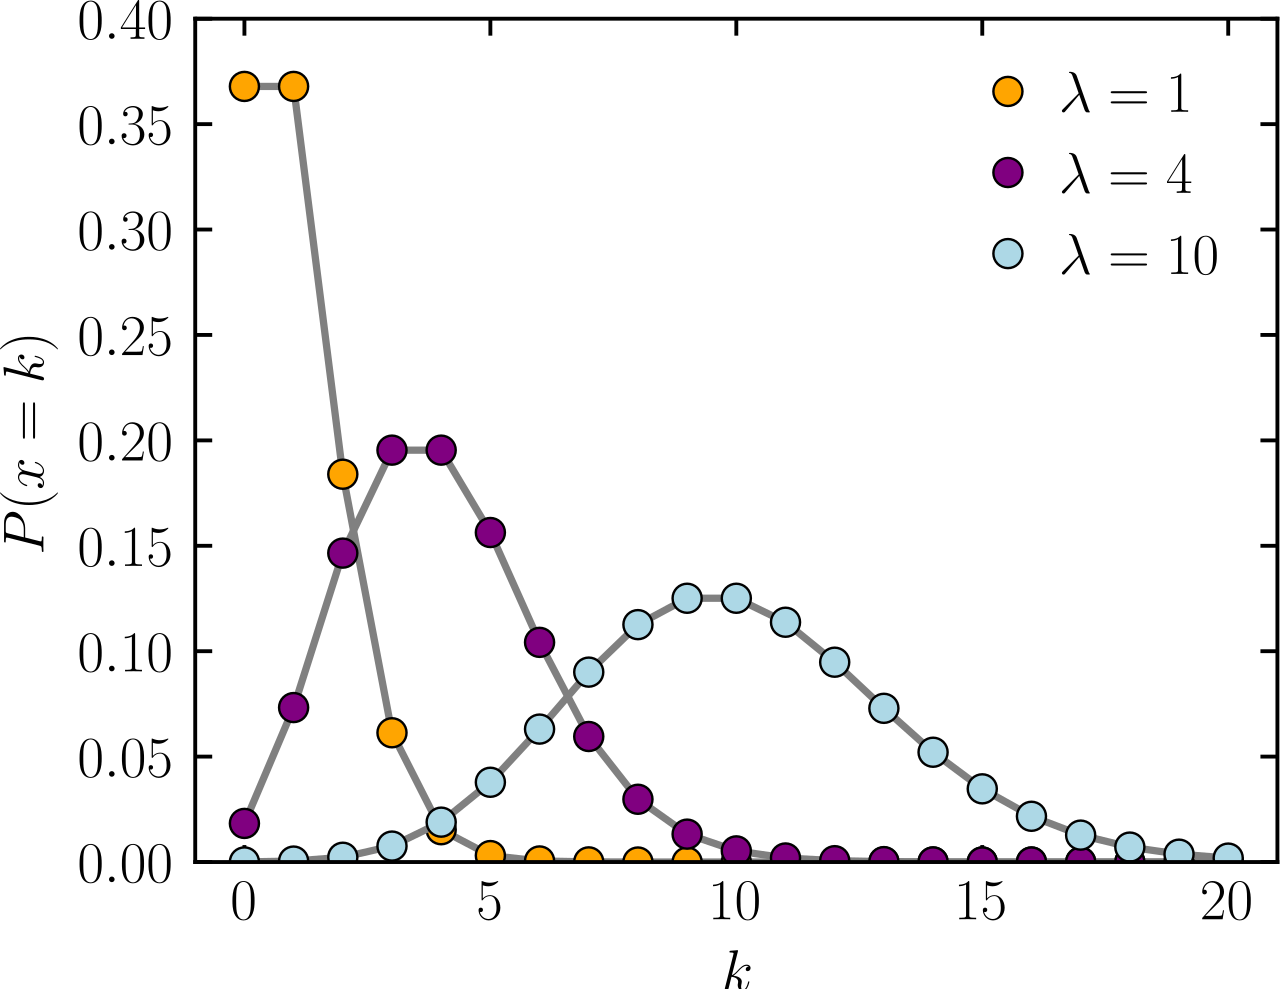
The only issue I see with this is that both of your data series are not normal distributions. They look more like something called a Poisson distribution, so it would be possible to adapt your code to use this instead.
These distributions just describe how the data is distributed, just like your histograms. They can be used to help identify outliers, which is what you are trying to do. The method using the normal distribution I described is probably the easiest to implement since the SMA and StdDev are already methods included in NinjaTrader.
Anyway, this is a fun project.
Essentially yes. In a normal distribution, 99 percent of the data will fall within Mean +- 3*StdDev.
In your case, you mentioned you only want to filter out data that is larger in value, so we ignore the lower bound. As such you could filter/reset anything above Mean + Constant * StdDev. The constant will require some tweaking to get it exactly how you want, but you can look at this table to find what you want the constant to be :
This idea is only to avoid sorting every tick, since this can cause performance issues if its done on large data sets and many charts. You could have a SMA on a period of 500, and a StdDev on a period of 500, which would keep track of the mean and the standard deviation on the last 500 data points in your series. I assumed you wanted over the last 500 due to the histograms you displayed below.
If anything is above Mean + Constant * StandardDeviation ---> Set to Value to make insignificant (either mean, median, mode), or if you are using a list you can remove the element.
All this method would require is updating 4 extra data series rather than sorting two data series. Updating a data series with 1 new value is much more computationally efficient than sorting a whole array/list. However, if you are only sorting 20 items with COBC = true, then Koganam's recommendation is better.
The only issue I see with this is that both of your data series are not normal distributions. They look more like something called a Poisson distribution, so it would be possible to adapt your code to use this instead.
These distributions just describe how the data is distributed, just like your histograms. They can be used to help identify outliers, which is what you are trying to do. The method using the normal distribution I described is probably the easiest to implement since the SMA and StdDev are already methods included in NinjaTrader.
Anyway, this is a fun project.
Comment